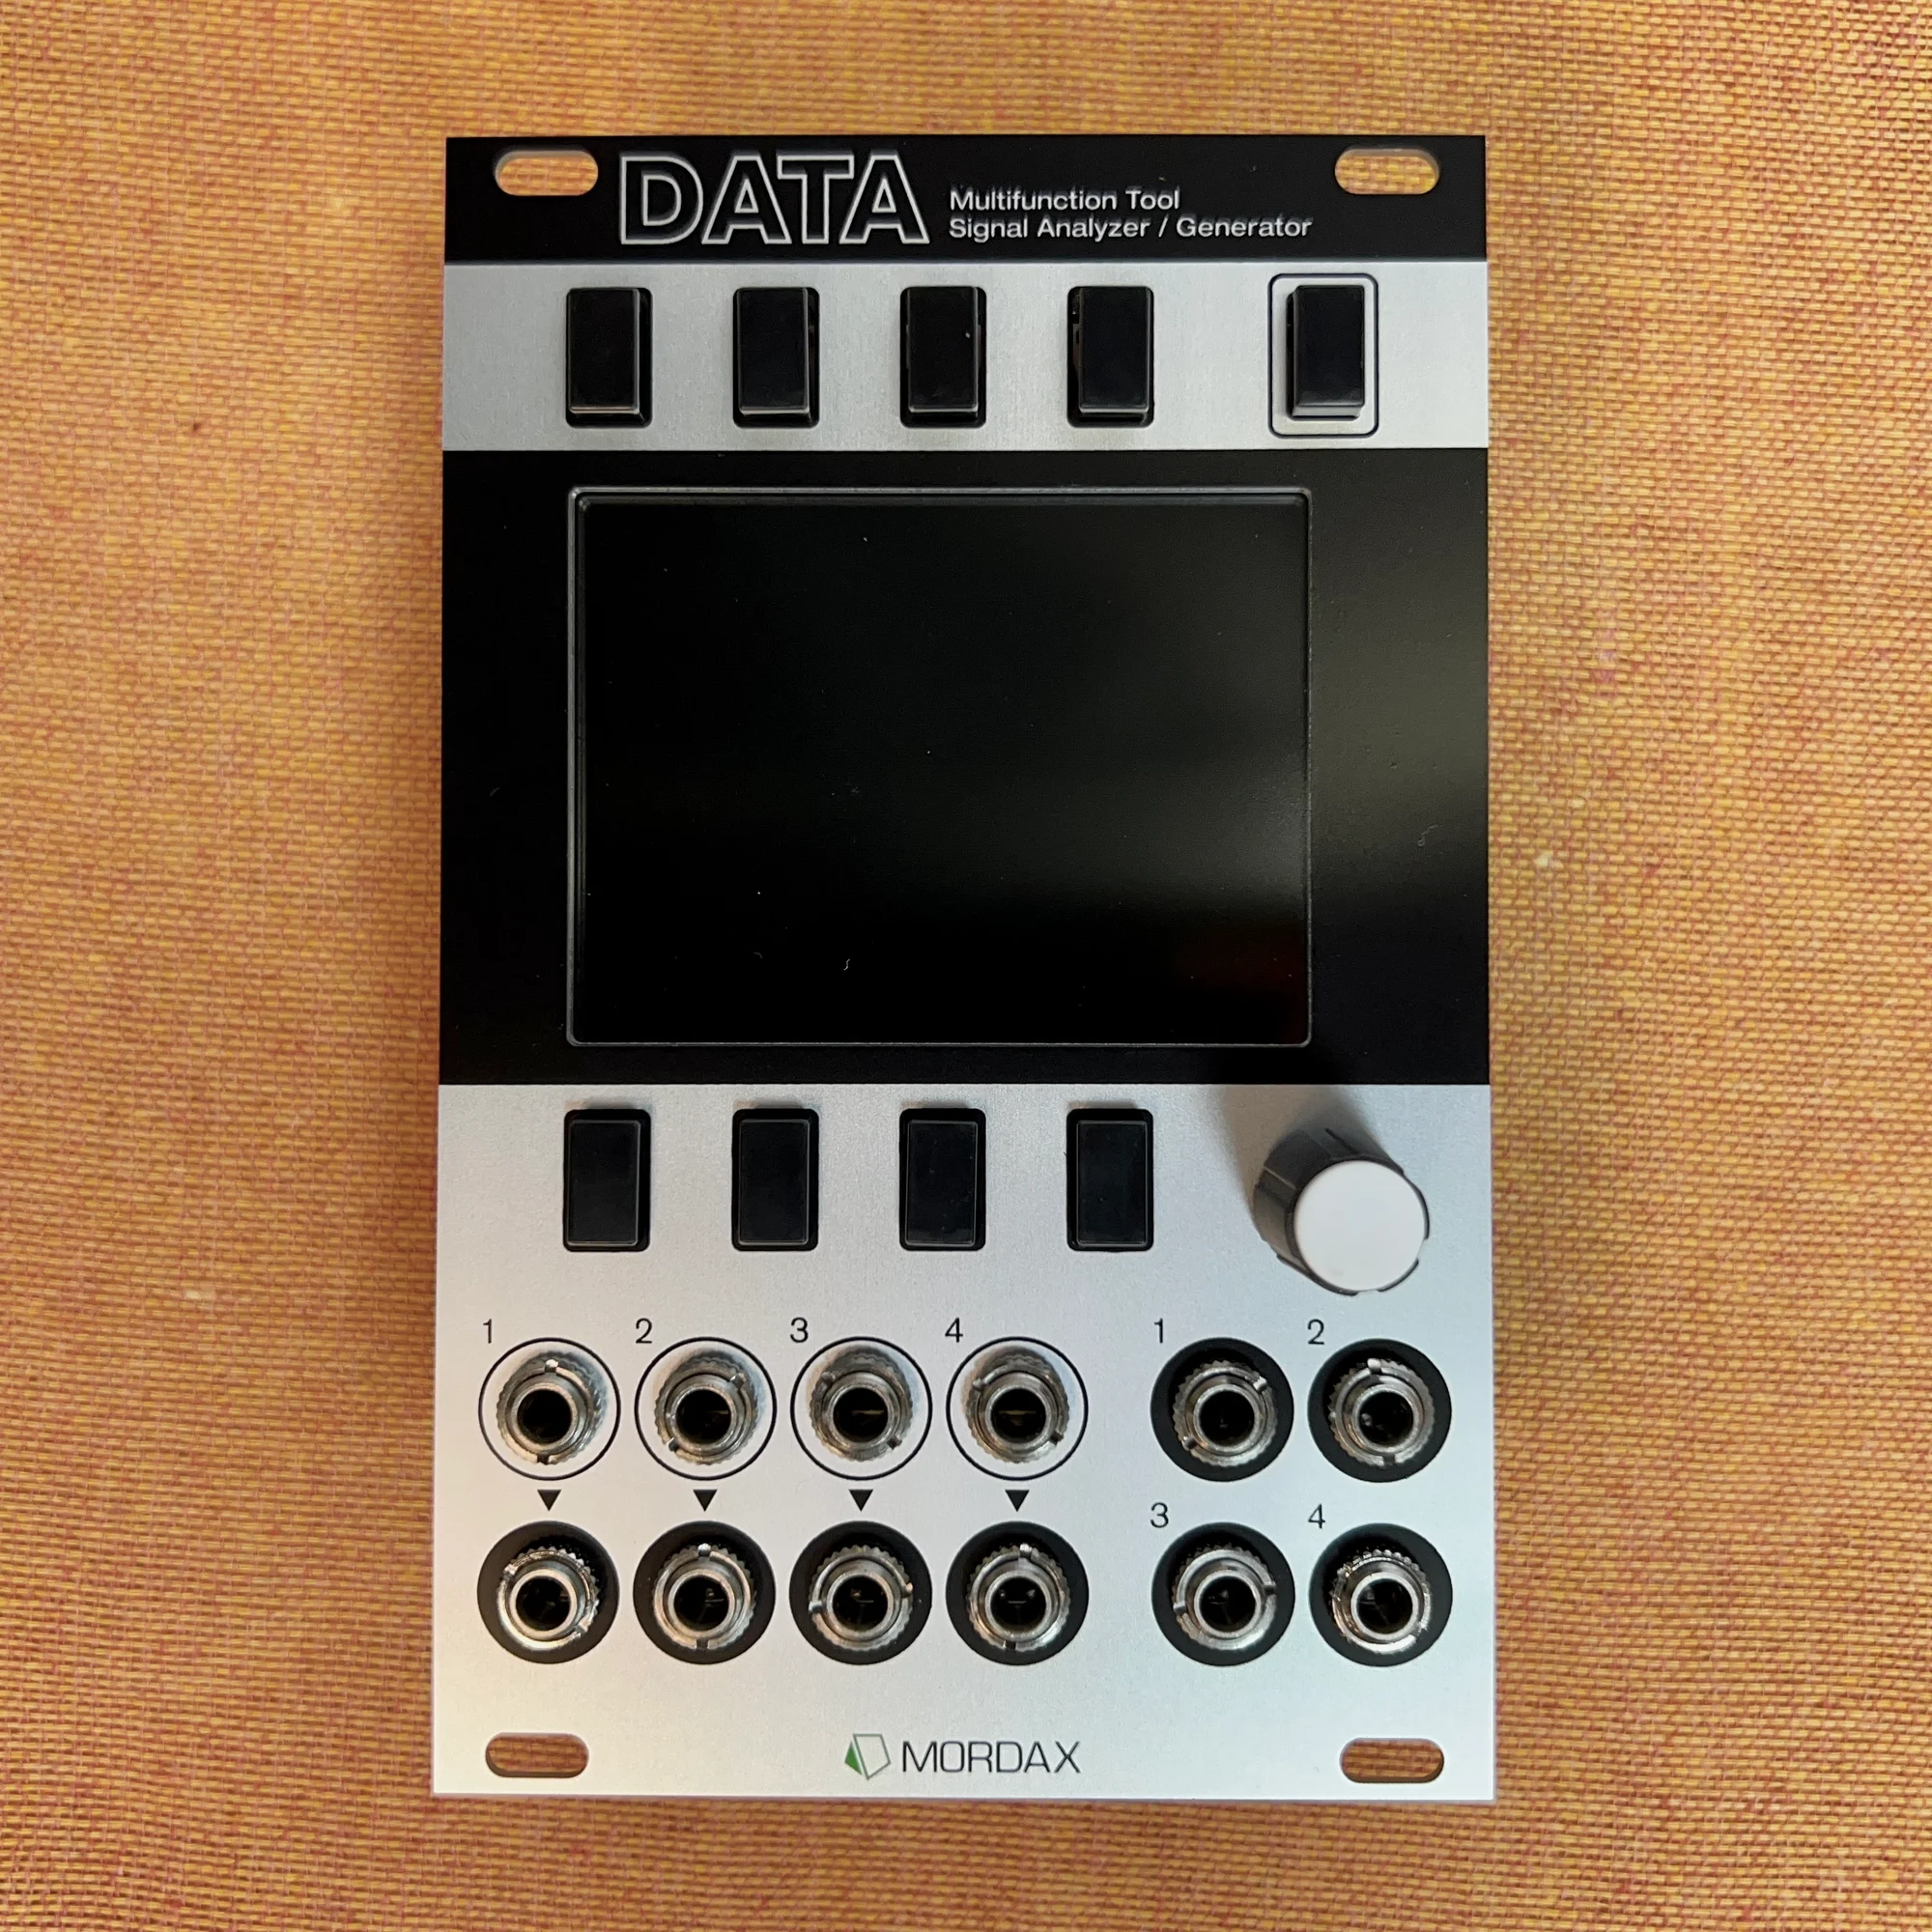
This is EP.2 of the Mordax DATA guide series. This time, I'll cover the tuner program, which measures the frequency of an input signal, and the spectrum analyzer & spectrograph programs, which display a signal's harmonic content.
EP.1 dealt with the oscilloscope, which shows voltage waveforms along a time axis. The programs covered this time are for looking at a signal from the "frequency" side of things. The tuner displays a signal's fundamental frequency as a note name, and the spectrum programs visualize which harmonics make up the signal.
Takazudo Modular publishes manuals and related documents with Japanese translations. See the links below.
The demo video in this article was published in 2015, before the DATA's production firmware shipped, so it shows a prototype. For the tuner and the spectrum programs, though, everything described here still applies on the current firmware (SYS V01.02.05) — ±0.01Hz accuracy, the 27.50Hz to 2,960Hz range (A0 to roughly F#7), and the Normalize guidance (for signals under roughly 6V peak-to-peak, not recommended above 2,200Hz) all still hold.
Display colors were adjusted for the production firmware, so the video captures may not look quite the same as your own unit.
Tuner
The tuner program measures the frequency of an input signal and automatically displays the nearest note name on the chromatic scale. Alongside that, it calculates the deviation (the difference in Hz) between the measured frequency and the frequency of the nearest note.
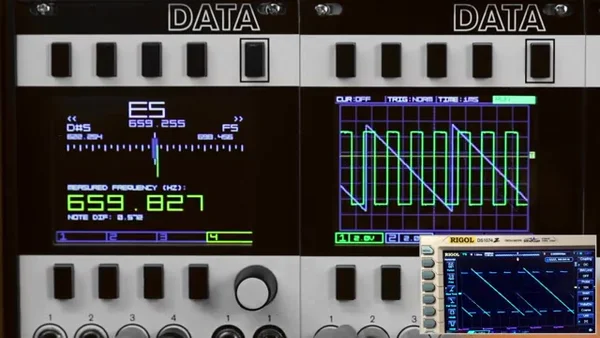
On screen, the nearest note name and its frequency appear in the center of the tuning bar, with the adjacent notes (Next Note) on either side. The actual measured frequency is shown below that in large digits. In the demo video, a square wave from an Intellijel Dixie 2 and a sawtooth wave from a TipTop Z3000 are fed into channels 1 and 2 respectively, the Dixie 2 is tuned to E5, and then the channel is switched over to the Z3000 to tune it to that same E5.
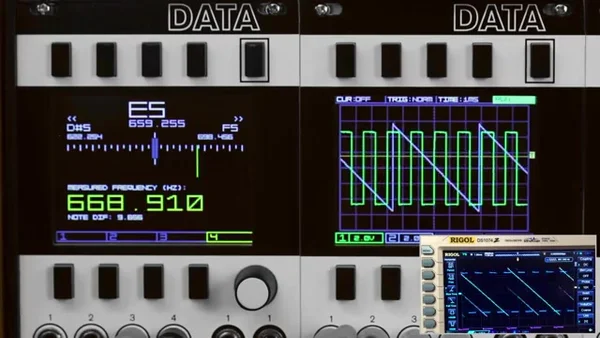
Measurement accuracy is ±0.01Hz, and the measurement range is 27.50Hz to 2,960Hz (A0 to roughly F#7). Since you can pick any one of the four input channels to measure, you can do things like quickly tuning multiple VCOs into a chord.
If the input signal falls well below 10V peak-to-peak (roughly under 6V peak-to-peak), turning on the Normalize function keeps the analysis working even with a weak signal. That said, normalizing can affect measurement accuracy, and it's not recommended for signals above 2,200Hz. When measuring a high-frequency, low-amplitude signal, turn normalize off and boost the signal with an external gain amp or similar before feeding it in.
Spectrum Analyzer
Sound (and periodic signals in general) can be expressed as a collection of sine waves with various frequencies and amplitudes. That collection is the signal's frequency spectrum, and each individual sine wave is a harmonic (partial) of that signal. A square wave, for example, can be approximated by adding sine waves at odd-numbered multiples of the fundamental.
The spectrum analyzer takes a time-domain signal and displays it in the frequency domain, showing you the harmonic components that make up the signal. This is accomplished with a Fast Fourier Transform (FFT). Each harmonic is displayed as a bar graph, and the taller and brighter the bar, the greater the intensity in that frequency band.
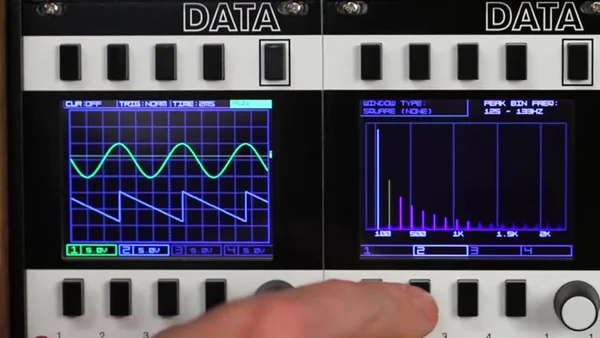
In the demo video, a sine wave and a sawtooth wave from the Dixie 2 are fed in, showing that the sine wave has a single harmonic while the sawtooth has multiple harmonics.
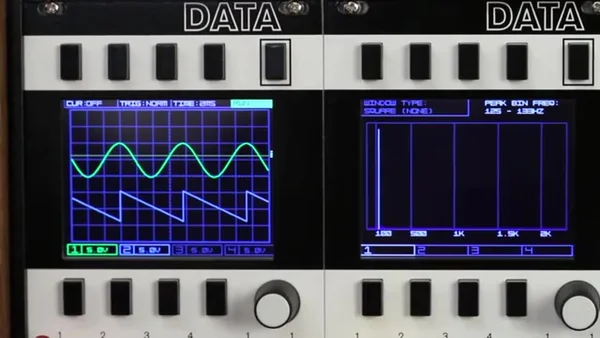
At the top right of the screen, the Peak Bin is displayed. This is the tallest bar in the bar graph — the frequency with the greatest intensity — which corresponds to the signal's first harmonic (the fundamental frequency).
You can also switch the window function (filter) applied to the input signal with Window Type. The window types are named after the people who devised them. Different window types change how each harmonic appears (how the spectrum bands spread out).
Spectrograph
The spectrograph is a program that displays the same FFT output as the spectrum analyzer, but along a time axis. A single column of pixels on the X axis corresponds to one frame of FFT analysis — the same thing you see in the spectrum analyzer. Where the spectrum analyzer expresses intensity as bar height, the spectrograph expresses it as a change in color.
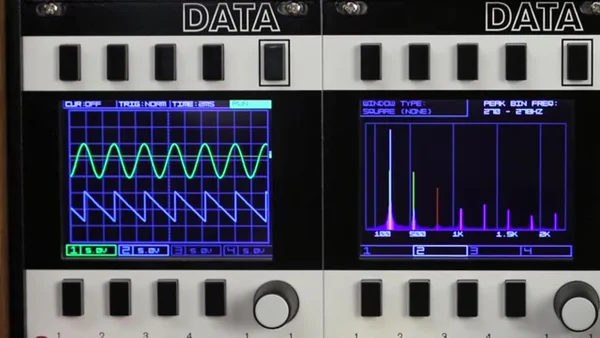
Just like the oscilloscope, the spectrograph has RUN/STOP controls for pausing and resuming the display, plus Clear for clearing the drawing.
Where the spectrograph really shines is in watching harmonic content change under FM (frequency modulation). The demo video shows linear FM applied to the Z3000's sawtooth wave with the modulation gradually increasing, how at low frequencies the modulator itself (the Dixie 2's sine wave) becomes visible, and how exponential FM produces a dramatically different pattern.
That wraps up EP.2. This time we covered the tuner and the spectrum analyzer & spectrograph. We looked at using the tuner to grasp a signal's fundamental frequency as a note name, and the spectrum programs to observe harmonic content and FM-driven changes in the frequency domain. Next time, in EP.3, I'll cover the programs on the signal-generating side — the waveform generator, clock output, and voltage monitor.
Note that the demo video referenced in this article is the official Mordax Systems demo video. Do check out the video to see the screens actually in motion.
Mordax DATA Product Details
You can view the product details for Mordax DATA below.
A 16HP multi-purpose utility combining an oscilloscope, spectrum analyzer, tuner, and voltage monitor, plus a 2-voice digital oscillator and clock generator. Helps you debug patches and understand how voltages behave at a glance. Black panel version.
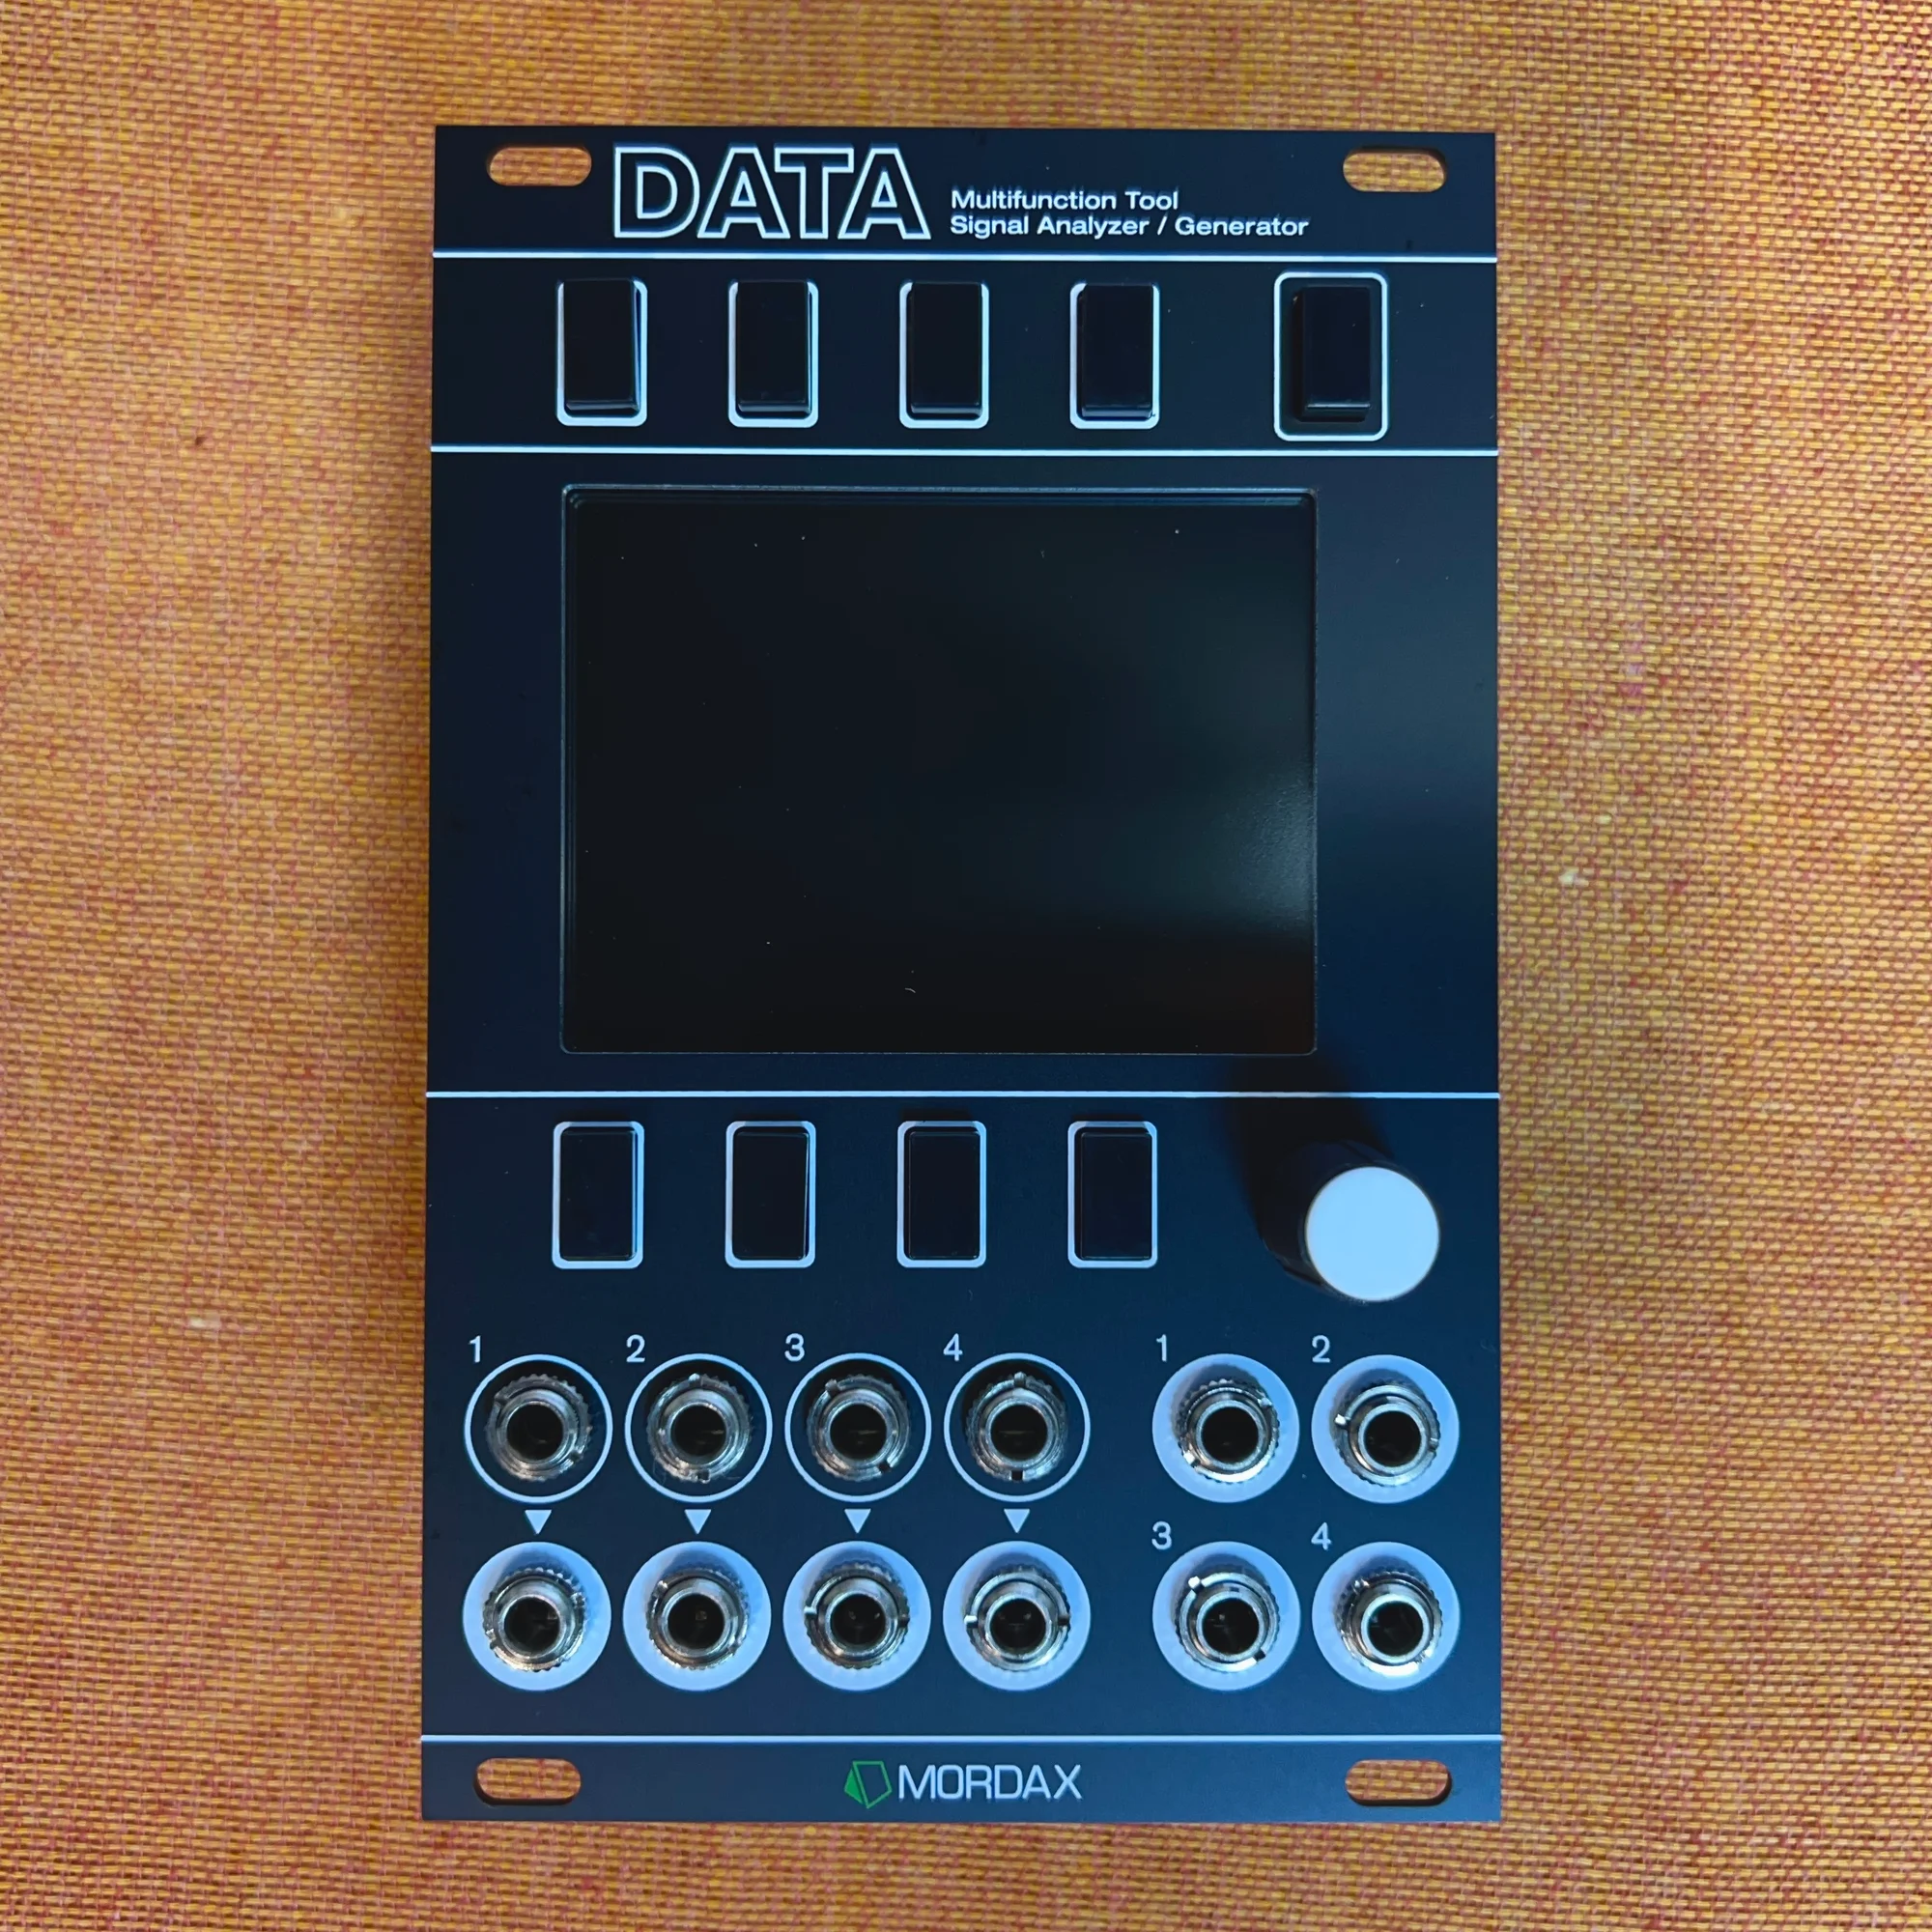
A 16HP multi-purpose utility combining an oscilloscope, spectrum analyzer, tuner, and voltage monitor, plus a 2-voice digital oscillator and clock generator. Helps you debug patches and understand how voltages behave at a glance. Silver panel version.